One hears this all the time: a picture is worth a thousand words. That is quite understandable as visual information transmits itself more quickly than verbal one. If we look at our thoughts, we will see that first and foremost we think in pictures: If someone says “apple” we don´t imagine in our brain the word apple. Rather, we fabricate a mental picture of a nice, round delicious apple! Maybe that’s the reason why infographics, that could be defined as graphic visual representations of information, are becoming so popular.
In the quick and overloaded world of the internet, infographics transmit information in a fast and attractive way. Instead of scrolling down a long article, infographics let you pleasantly absorb information through illustrations and colored charts. Besides, by using infographics, you will attract the audience into staying longer on your webpage, as they take their time decoding the data the image conveys. If they like the illustrations, they will most likely share the article as well.
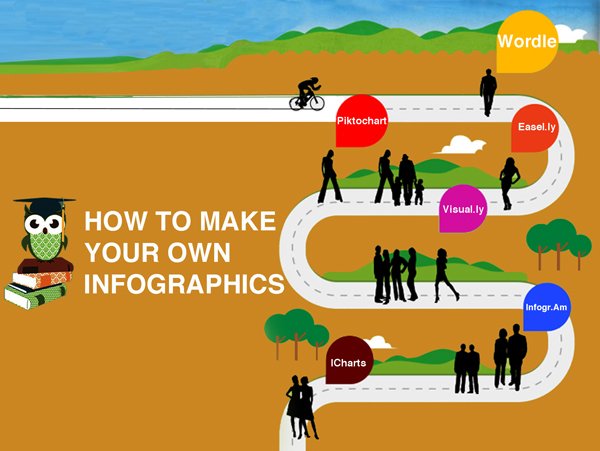
What are the necessary skills to generate catchy infographics? Even though not all of us have the ability to create images, there are tools available online which helps us organize visually the information we want to deliver. In this article we will look at ten of the best tools that can help us fabricate infographics:
1. Wordle
Wordle is a simple web app for generating “word clouds” from the text you provide. While the clouds give greater prominence to words that appear more frequently in the source text, you can also twist your clouds with different fonts, layouts, and color schemes.
2. Piktochart
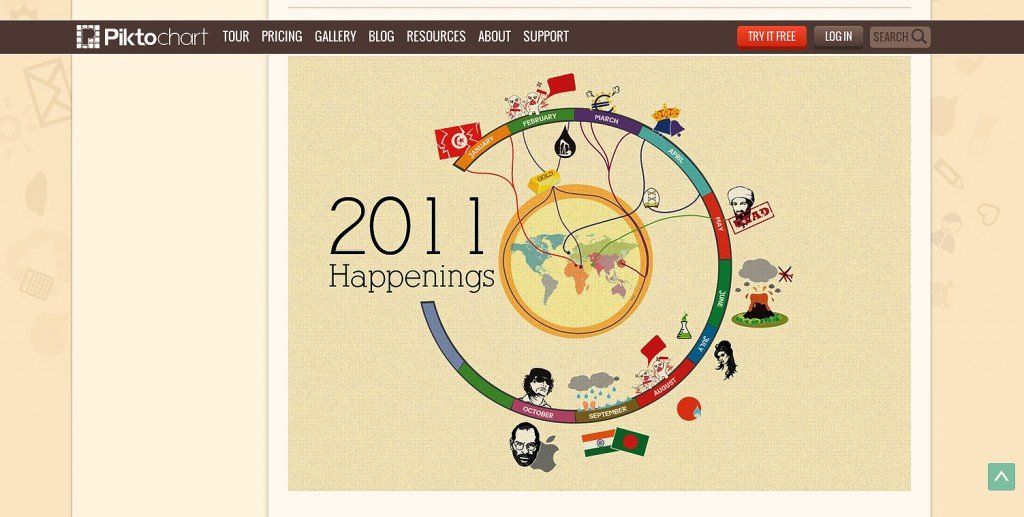
With Piktochart, you are able to create an innovative Infographic using a combination of different types of visualizations: themes, icons, vectors, images and chart exporter. The software has intuitive drag-and-drop and click your way tools, that let you experiment with different color schemes, shapes and fonts. Finally, you can export the materials as static or html to easily embed it for use at your site. You can choose between pro or free templates.
3. Easel.Ly
Easel.ly is a fun tool to create your Infographics. It uses with drag and drop features and a simple interface. You can effortlessly create and share visual ideas online, supported by ‘vhemes’ or visual themes that help you get started. The idea is to just drag and drop a ‘vheme’ onto your canvas to turn your idea into a full infographic. The site offers video tutorials that help you in your first steps.
4. Visual.Ly
Visually helps you customize infographics in seconds, and no, you don’t have to be an analyst or designer to make infographics with Visually Create. Visual.ly allows you to also discover infographics and favorites from other users as Visual.ly is a showcase of creative designs. You can embed them in your blogs and forums without restriction. The Visual.ly blog is also a worthy read if you are interested in the cutting edge of image facilitation.
5. Infogr.Am
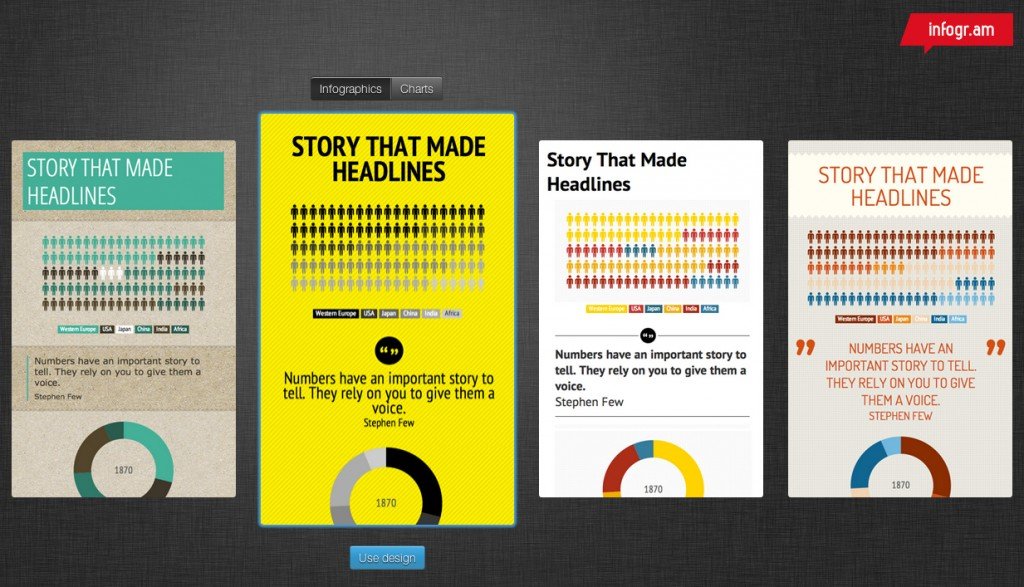
Infogr.am is a simple yet most exciting way to create static and interactive infographics. The site invites you into importing raw data to Infogr.am, and its online tools will help you turn that data into a wonderful looking chart or full-blown infographic in minutes.
6. Many Eyes
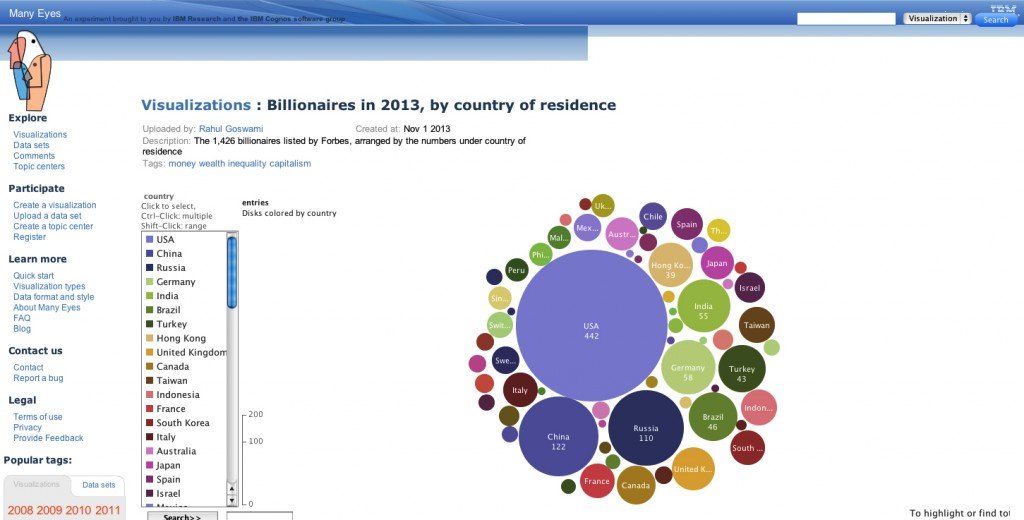
Many Eyes is an experiment done by IBM Research and the IBM Cognos software group. Their ethos is: ‘Finding the right way to view your data is as much an art as a science’. Many Eyes provides a range of visualizations from the ordinary to the experimental, where each can be put together with a click.
7. Venngage
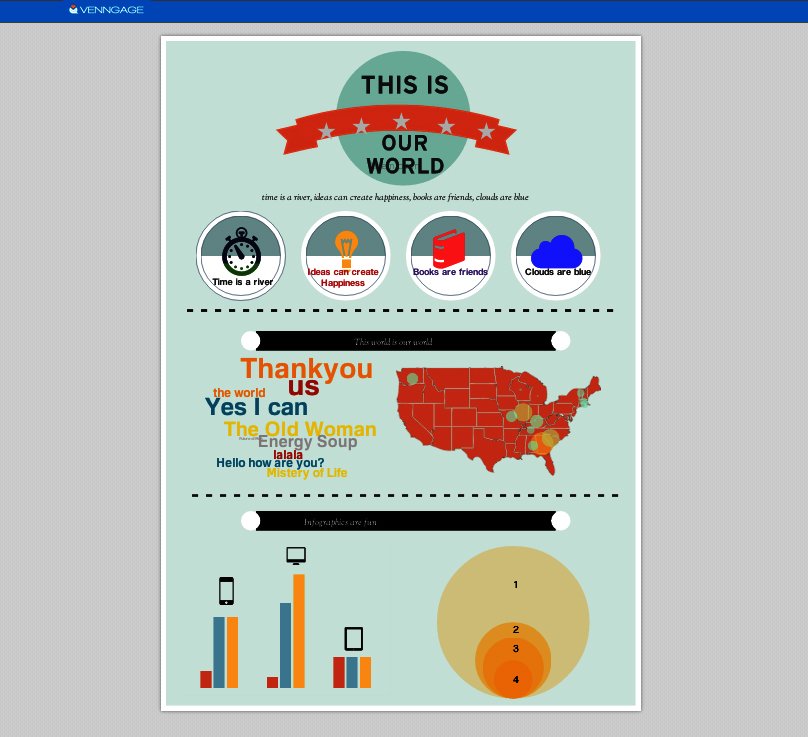
Venngage is an online infographics tool that helps you create and publish custom infographics, and at the same time, engage viewers and track results. In order to use Veegage you have to create an account. Then you can choose from a whole set of templates, some free, some costing you some money. These allow you to play around, creating good-looking infographics in a quick way. You can play with text, color, and there are loads of images you can use.
8. ICharts
With iCharts, you can create great-looking charts in minutes with interactive and easy-to-share data. iCharts makes it easy to visualize, share and distribute big and small data.
9. Dipity
Dipity is a free digital timeline website, if you are looking for a different type of Infographics. The mission is to organize the web content by date and time. Dipity is the fastest and easiest way to bring history to life with stunning multimedia timelines.
10. TimelineJS
TimelineJS is a beautifully crafted timeline that is easy and intuitive to use. Even though it was created to help journalists, it might help you as well in your projects and websites. You can pull in media from different sources with built-in support for Twitter, Flickr, Google Maps, YouTube, Vimeo, Dailymotion, Wikipedia, SoundCloud and more. It requires that you have a basic understanding of google spreadsheets. The site offers as well a video tutorial that explains to you the basics of TimelineJS:
Finally if you are comfortable with softwares like Adobe Photoshop and Illustrator, you can create your own infographics. These links are very helpful:
- The Do’s and Don’ts of Infographic Design – A Smashing Magazine article.
- How To Create Outstanding Modern Infographics – a nice tutorial with Adobe Illustrator as the weapon of choice.
- Vector Infographic Kit offers reusable resources that shorten your design time. The free 3.5 MB file has about 50 infographic components. It is important to credit the source files.
If it is very easy to admire an infographic and absorb the information it conveys, to create an infographic is actually a lot of work. Hopefully, some of the tools offered in this article will help!

Maria Fonseca is the Editor and Infographic Artist for IntelligentHQ. She is also a thought leader writing about social innovation, sharing economy, social business, and the commons. Aside her work for IntelligentHQ, Maria Fonseca is a visual artist and filmmaker that has exhibited widely in international events such as Manifesta 5, Sao Paulo Biennial, Photo Espana, Moderna Museet in Stockholm, Joshibi University and many others. She concluded her PhD on essayistic filmmaking , taken at University of Westminster in London and is preparing her post doc that will explore the links between creativity and the sharing economy.


